Welcome to RADON-IDE’s documentation!
Introduction
The RADON IDE provides a web-based development environment for multi-user usage and a front-end for the interaction with the RADON framework by enabling the interaction with the RADON tools and the access to the shared spaces of the RADON artifacts (i.e. RADON models).
The RADON development environment is based on the Eclipse Che technology: an open source developer workspace server which comes with a cloud integrated development environment (IDE) used by developers to create applications without the need to install any software on their local system.
The RADON IDE provides standard functionalities to support development activities (e.g. debugging functionalities and error checking capabilities) along with, according to the RADON methodology, specific capabilities as listed below:
- Authorization management: enables the RADON users to receive access to the development environment in order to interact with the RADON framework.
- Manage RADON workspaces: permits the creation of new RADON workspaces (or open existing ones) having a stack with all the needed tools, plugins and extensions enabled.
- Manage application blueprints: allows the RADON users to invoke and use the different RADON tools to manage the application blueprints according to the workflows identified by the RADON methodology.
- Manage test specification: permits to define test cases and run them through the invocation of the RADON tools.
- Deploy application: allows a RADON user to start the deployment of a blueprint application on the production/testing environment.
Technical Details
The final release of the RADON integrated framework realizes a development environment giving access to the repositories of RADON artifacts and enabling the interaction with the following RADON tools: Graphical Modeling Tool (GMT), Verification Tool (VT), Decomposition Tool (DT), Defect Prediction Tool (DPT), Continuous Testing Tool (CTT), Template Library (TL) and the Delivery Toolchain. These are the set of actions that can be performed by an authenticated RADON user:
- Create or open (if already created previously) a RADON workspace with a modeling project on it, providing access to the shared repositories of RADON artifacts and with the integrated RADON tools enabled;
- Availability of the Graphical Modeling Tool (GMT) to be invoked on the RADON-IDE to model application topologies;
- Availability of the Verification Tool, Decomposition Tool, Defect Prediction Tool, and the Continuous Testing Tool, that can be invoked by the RADON user to verify CDL specifications on the RADON models, to optimize the deployment of the applications and to find the defects on the Infrastracture as Code (IaC) blueprints, and to test applications, respectively;
- Export of the modelled application in TOSCA’s Cloud Service Archive (CSAR) format for the deployment;
- Start the deployment process of the CSAR by publishing it on the Template Library and by means of the Delivery Toolchain;
- Visualization of the deployment status and monitoring data on a browser window.
The above capabilities have been implemented by the customization of the Eclipse Che environment with the realization of a new RADON Stack (i.e a ready-to-go workspace), defining a custom che devfile including the following elements:
- A project (named radon-particles) that clones in the RADON workspace the TOSCA modeling entities from the RADON Particles GitHub repository;
- The set of Che plugins and Kubernetes components that have been developed to integrate the RADON tools.
The technical details of the RADON tools integrated and used in the final release are listed below:
- Graphical Modeling Tool: integrated on the RADON IDE as a Kubernetes component. It enables the users to create, develop, and model TOSCA service templates (i.e. RADON models), representing the applications that are deployed using the RADON Orchestrator. The GMT is able to interact with files and folders from the “modeling project” inside the underlying Che workspace. It offers also the feature to package and save a CSAR of a selected RADON Model to the workspace in order to give the possibility to process it using other RADON tools or deploy it using the RADON Orchestrator.
- Verification Tool: integrated on the RADON IDE with a Che plugin and a Kubernetes component. The users are able to run the verification, correction and learning modes of the VT by right-clicking on any file with the extension “.cdl” and clicking on the Verify, Correct or Learn buttons in the resulting context menu. The result of the task is then displayed in a new output sub-window.
- Decomposition Tool: integrated on the RADON IDE with a Che plugin. It enables the users to access a public service that makes the DT available trough different programs, namely decomposition, optimization and enhancement using REST APIs. A user can perform a right-click on a service template (.yaml) and then click the “Optimize” button in the pop-up menu. After the optimization program completes, the service template is updated according to the optimal deployment scheme, and the minimum operating cost is printed in the “Output” window.
- Defect Prediction Tool: integrated on the RADON IDE with a Che plugin. It enables the users to identify potentially defective IaC blueprints. The user can interact with it by right-clicking on a YAML-based Ansible file or a Cloud Service Archive (CSAR), and click Run detection. The results (consisting of the metrics extracted from the script and its defect-proneness) are displayed in a new active tab.
- Continuous Testing Tool: integrated on the RADON IDE with a Che plugin and a Kubernetes component. A user can create CTT configuration file, which after being completed, can be executed again via a right-click on the configuration file and selecting “Execute test configuration”. The results of the tests are stored in the project folder.
- Template Library: integrated on the RADON IDE with a Che plugin. It enables the users to manage, store and retrieve the TOSCA modules and their implementations. The user can interact with it by right clicking on the file from file explorer or in the editor and select one of the dropdown options available.
- Delivery Toolchain: integrated on the RADON IDE with
- A Che plugin for the xOpera SaaS Orchestrator. It eneables the users to create and run deployment projects inside the xOpera SaaS Orchestrator;
- A Che plugin implementing the Configure CI and Trigger CI commands to configure and trigger a CI/CD pipleline on a Jenkins server in order to add more flexibility;
- A Che plugin implementing the Show deployment status command to open the xOpera SaaS Orchestrator console from the IDE and the Open Monitorig page command to open the Monitoring Dashboard from the IDE.
Getting Started
The following documentation explains how to use the final release of the RADON integrated framework by means of the RADON IDE.
Access to the RADON IDE
Use the following form to request access to the RADON IDE. An account will be created and the credentials will be sent via the email specified in the form, along with the URL to the RADON Stack devfile.
After receiving the credentials, login to the RADON IDE (Figure 1) connecting to the Che Login page to access the main Che dashboard (Figure 2). In the Workspaces tab the list of already created workspaces is visible and it is possible to create new ones.
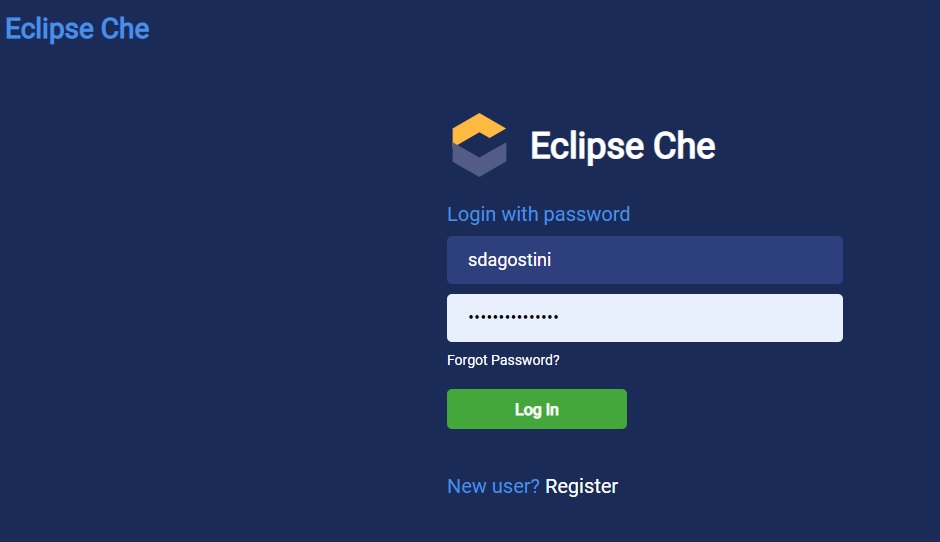
Figure 1: RADON IDE Login.
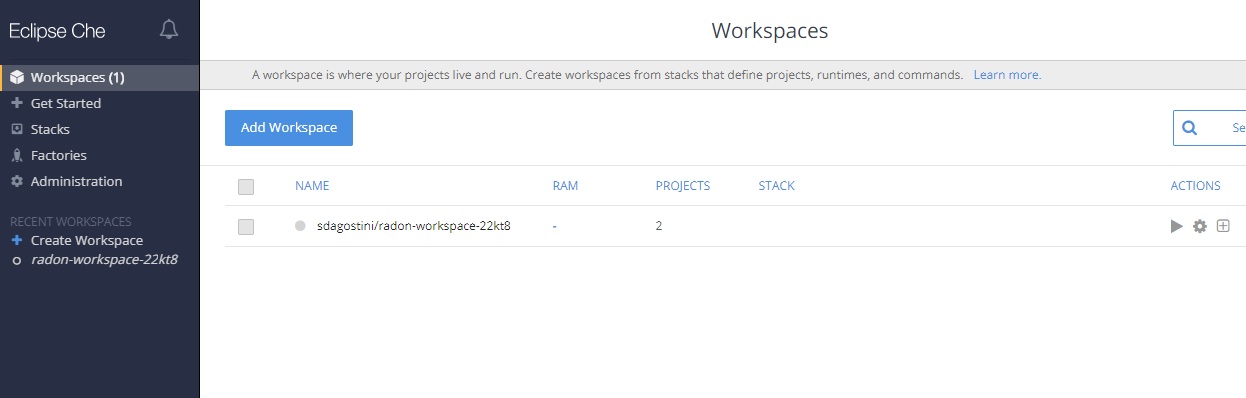
Figure 2: IDE Dashboard.
Create a RADON workspace
In the Eclipse Che dashboard select Create Workspace tab and then Custom Workspace. Copy the URL of the RADON Devfile received by email and paste it in the field Enter devfile URL under Devfile section. Then click on Load Devfile and once the RADON devfile has been loaded click on the Create & Open button (Figure 3).
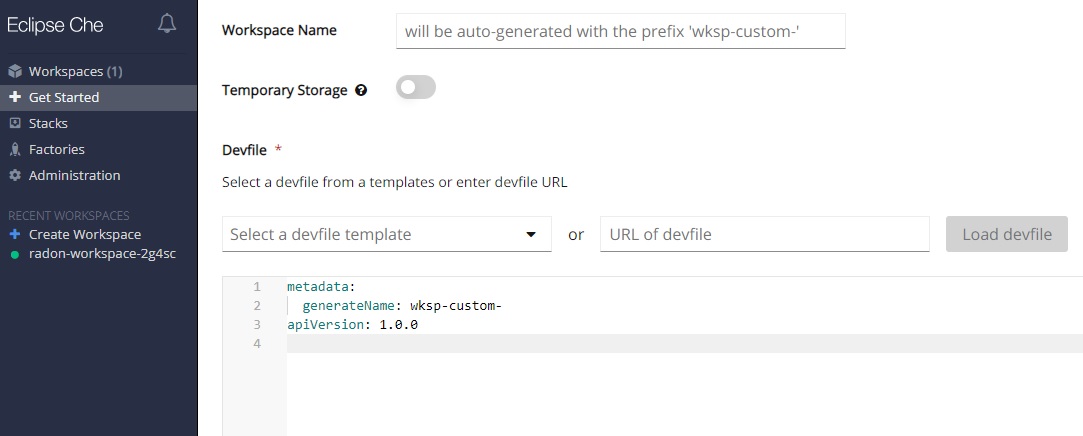
Figure 3: Create a RADON Workspace.
As depicted in Figure 4, a RADON workspace is started. It provides the “radon-particles” modeling project with a directory structure compliant with the GMT and the set of integrated RADON tools enabled (i.e., GMT, VT, DT, DPT, CTT, TL, Delivery Toolchain).
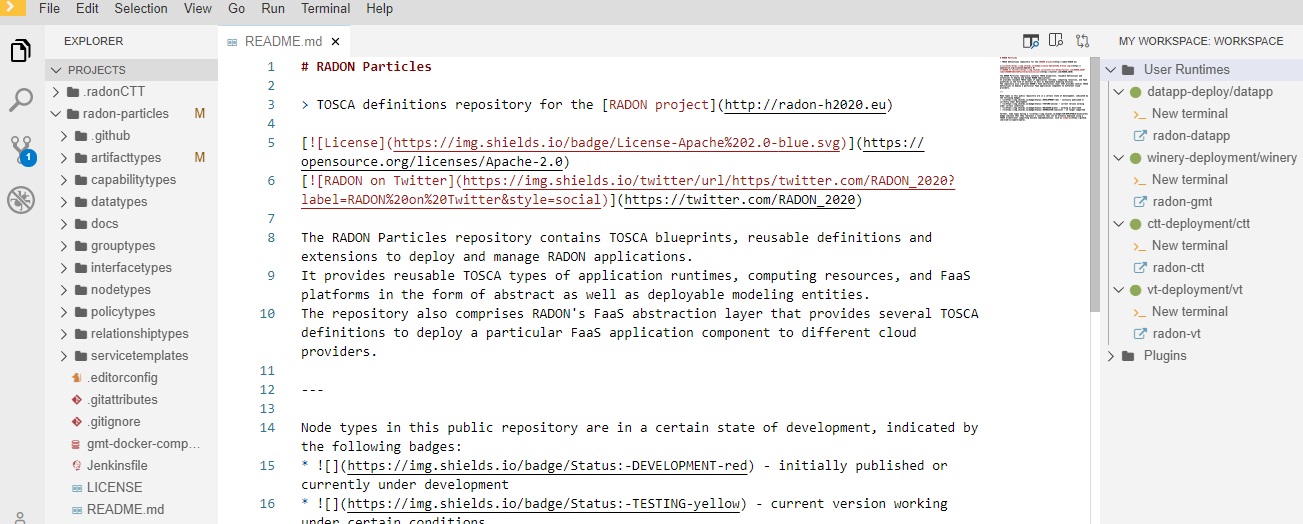
Figure 4: RADON Workspace.
How to launch RADON tools
Graphical Modeling Tool
The GMT can be used within the RADON IDE to model an application. To launch the GMT, click on the radon-gmt option, present on the My Workspace right panel, as depicted in Figure 5.
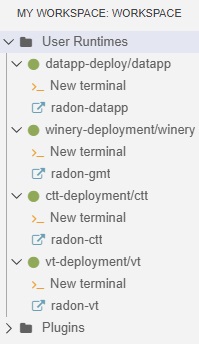
Figure 5: How to launch GMT.
The browser window of the GMT will be opened (Figure 6) to create or adapt existing TOSCA modeling entities as well as to compose new applications interacting with files and folders from the “modeling project” inside the workspace.
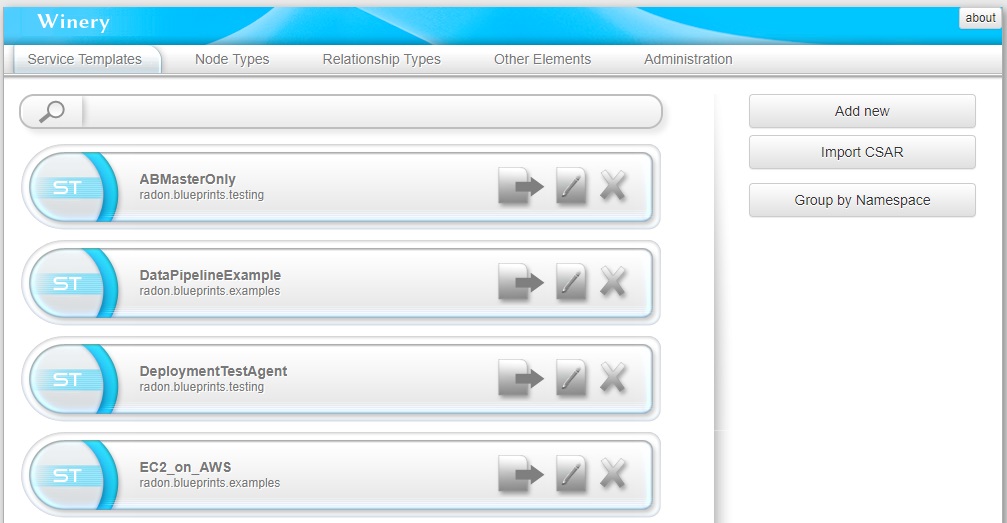
Figure 6: GMT Dashboard: List of available RADON Models.
GMT is a web-based environment to graphically model TOSCA topologies. Follow the official user guide to learn how to use the tool.
One important aspect is the Export to Filesystem functionality (Figure 7). It permits to package and save a CSAR of a selected RADON Model to the workspace to process it using other RADON tools or to deploy it using the Orchestrator. The RADON model will be exported in a CSAR file and will be store in the radon-csar folder (Figure 8).
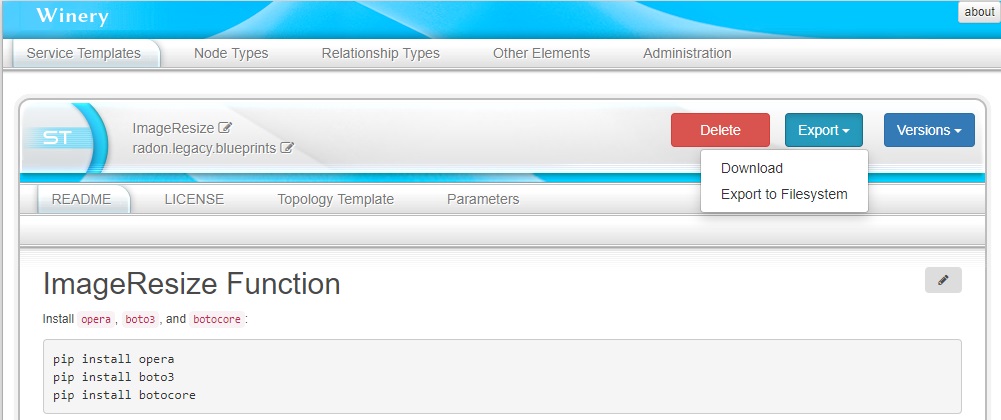
Figure 7: Export CSAR.
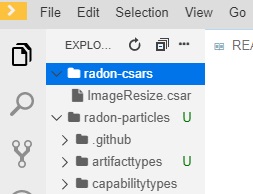
Figure 8: radon-csar folder.
Verification Tool
The Verification Tool is used within the RADON IDE to verify that a RADON model conforms to the CDL specifications. The .cdl files defining the CDL specifications for a specific RADON model can be edited, imported and updated within the workspace of IDE (Figure 9). To get started, you can clone the verification tool sample project in the workspace, which contains a sample TOSCA model and a CDL specification. To clone this project use the Git functionalities provided in the workspace as described below:
- Press Ctrl+Shift+P to open the command palette.
- Select the Git:Clone command.
- Type the repository URL of the verification tool sample project.
- Press Enter to clone the project in the workspace.
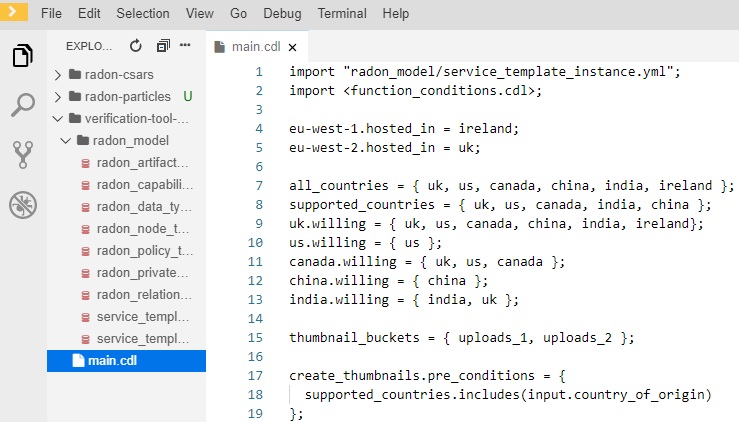
Figure 9: Edit CDL specifications.
To verify that the RADON model conforms to these CDL specifications, make a right-click on the .cdl file and select the Verify option (Figure 10). The verification results are shown in the RADON Verification Tool output panel (Figure 11).
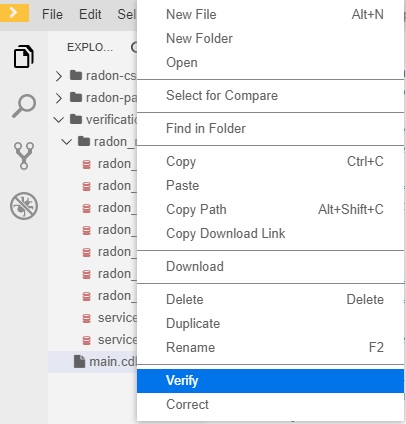
Figure 10: Verification of CDL specifications by means of the VT.
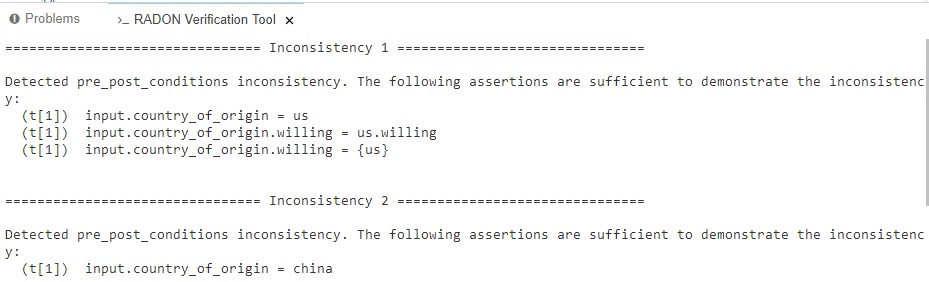
Figure 11: RADON Verification Tool output panel.
In addition to the verification mode of the tool, the VT also allows users to search for corrections to a RADON model and to learn additional constraints in a CDL specification. These two modes can be launched in a similar way, by selecting the Correct or Learn option after right-clicking on a .cdl file.
Decomposition Tool
The Decomposition Tool is used within the RADON IDE to decompose the architecture of an abstract RADON model and to optimize the deployment of a concrete RADON model. To get started, you can clone the decomposition tool sample project in the workspace:
- Press Ctrl+Shift+P to open the command palette.
- Select the Git:Clone command.
- Type the repository URL of the decomposition tool sample project.
- Press Enter to clone the project in the workspace.
This project includes three folders, namely mono-app, micro-app and demo-app. The mono-app and micro-app folders provide sample service templates, model.tosca, for an abstract monolithic and an abstract microservice application respectively. The demo-app folder provides two sample service templates, open_model.tosca and closed_model.tosca, for a concrete demo application (thumbnail generation).
To invoke the decomposition functionality of the DT, right-click on model.tosca in either the mono-app or the micro-app folder and select the Decompose option. The execution of the decomposition procedure will be displayed in the Output window (Ctrl+Shift+U to open). After the decomposition procedure completes, the service template will be updated according to the desired decomposition solution.
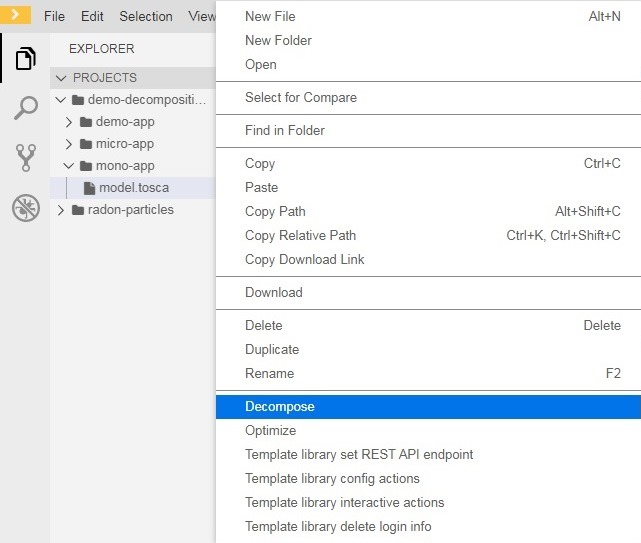
Figure 12: Decompose architecture by means of DT.
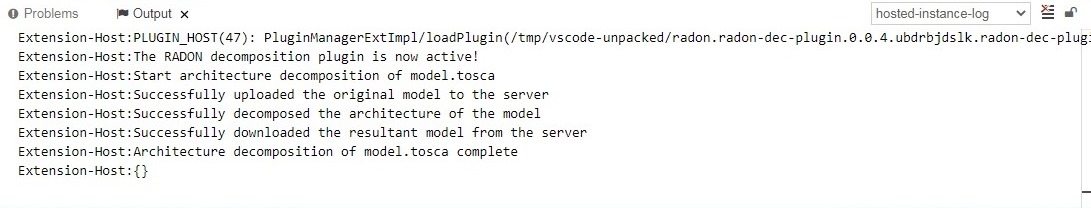
Figure 13: Output of architecture decomposition.
To invoke the optimization functionality of the DT, right-click on either open_model.tosca or closed_model.tosca in the demo-app folder and select the Optimize option. The execution of the optimization procedure will be displayed in the Output window (Ctrl+Shift+U to open). After the optimization procedure completes, the service template will be updated according to the optimal deployment scheme.
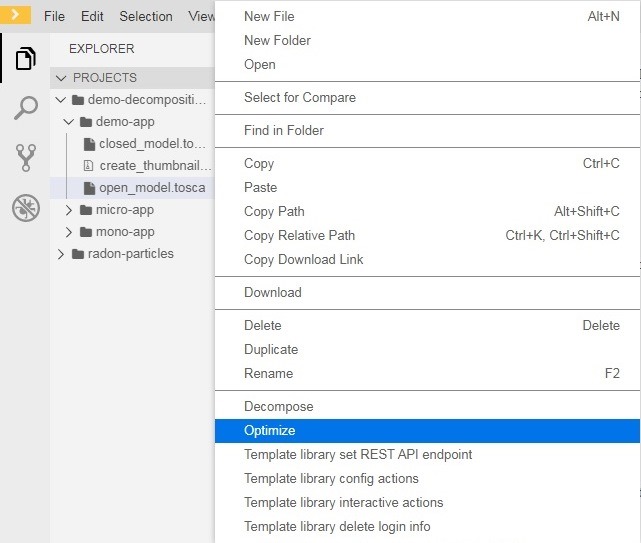
Figure 14: Optimize deployment by means of DT.
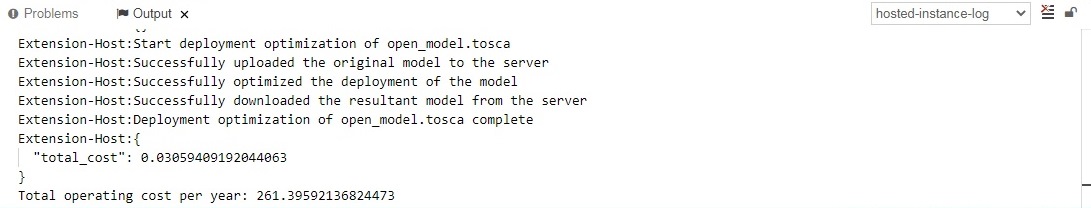
Figure 15: Output of deployment optimization.
Defect Prediction Tool
The Defect Prediction Tool is used within the RADON IDE to enable operators to identify potentially defective IaC blueprints in Ansible or Tosca, and their defect type. It consists of a Visual Studio Code extension integrated into an Eclipse Che environment, and provides a graphical user interface to run the detection on a given Ansible or Tosca blueprint and display the results. The extension is packaged as an Eclipse Che Theia plugin into a sidebar container. An operator can interact with it and invoke the detection by right-clicking on a YAML-based Ansible file (or TOSCA-based .csar folder) and select the Run Detection option (Figure 16). Alternatively, in case of YAML files, it is possible to run the detection by right-click on the active editor with the open YAML file and select “Run Detection”. The results, shown in Figure 17, consist of a table showing the values for each of the extracted metrics (highlighting those that might be critical because diverging from the community standard), and the blueprint’s defect type, if any, with a set of rules to interpret the decision.
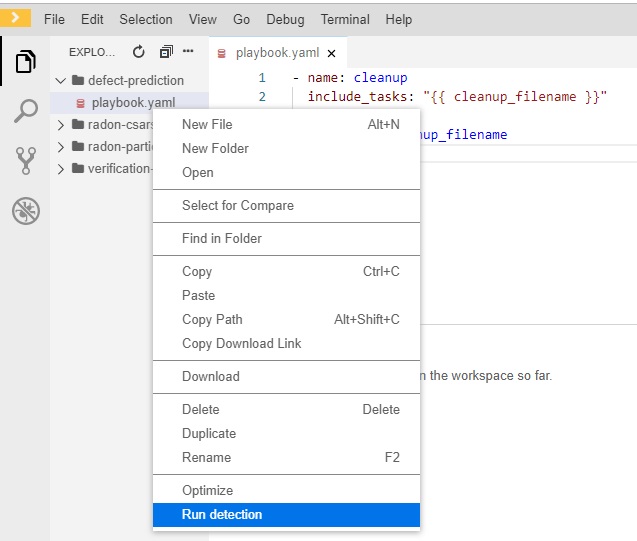
Figure 16: Check defects on an Ansible playbook by means of DPT
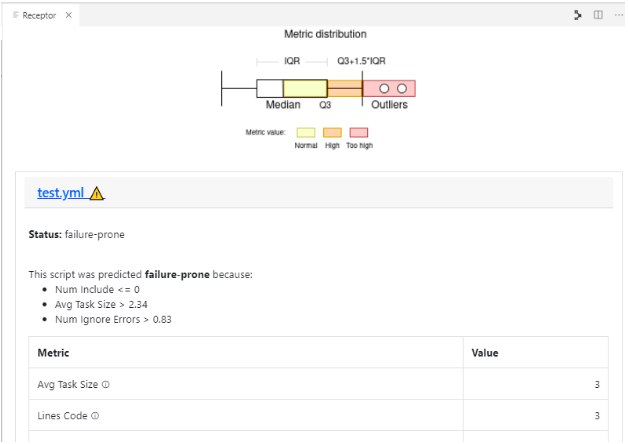
Figure 17: Defect Prediction Tool output window.
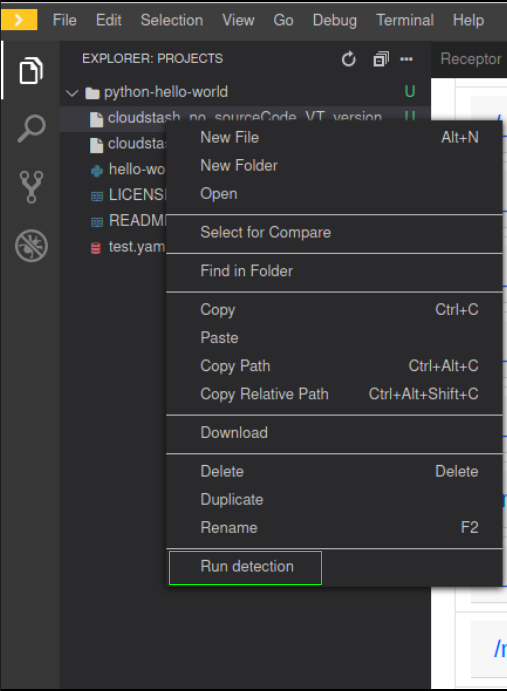
Figure 18: Check defects in a Cloud Service Archive by means of DPT
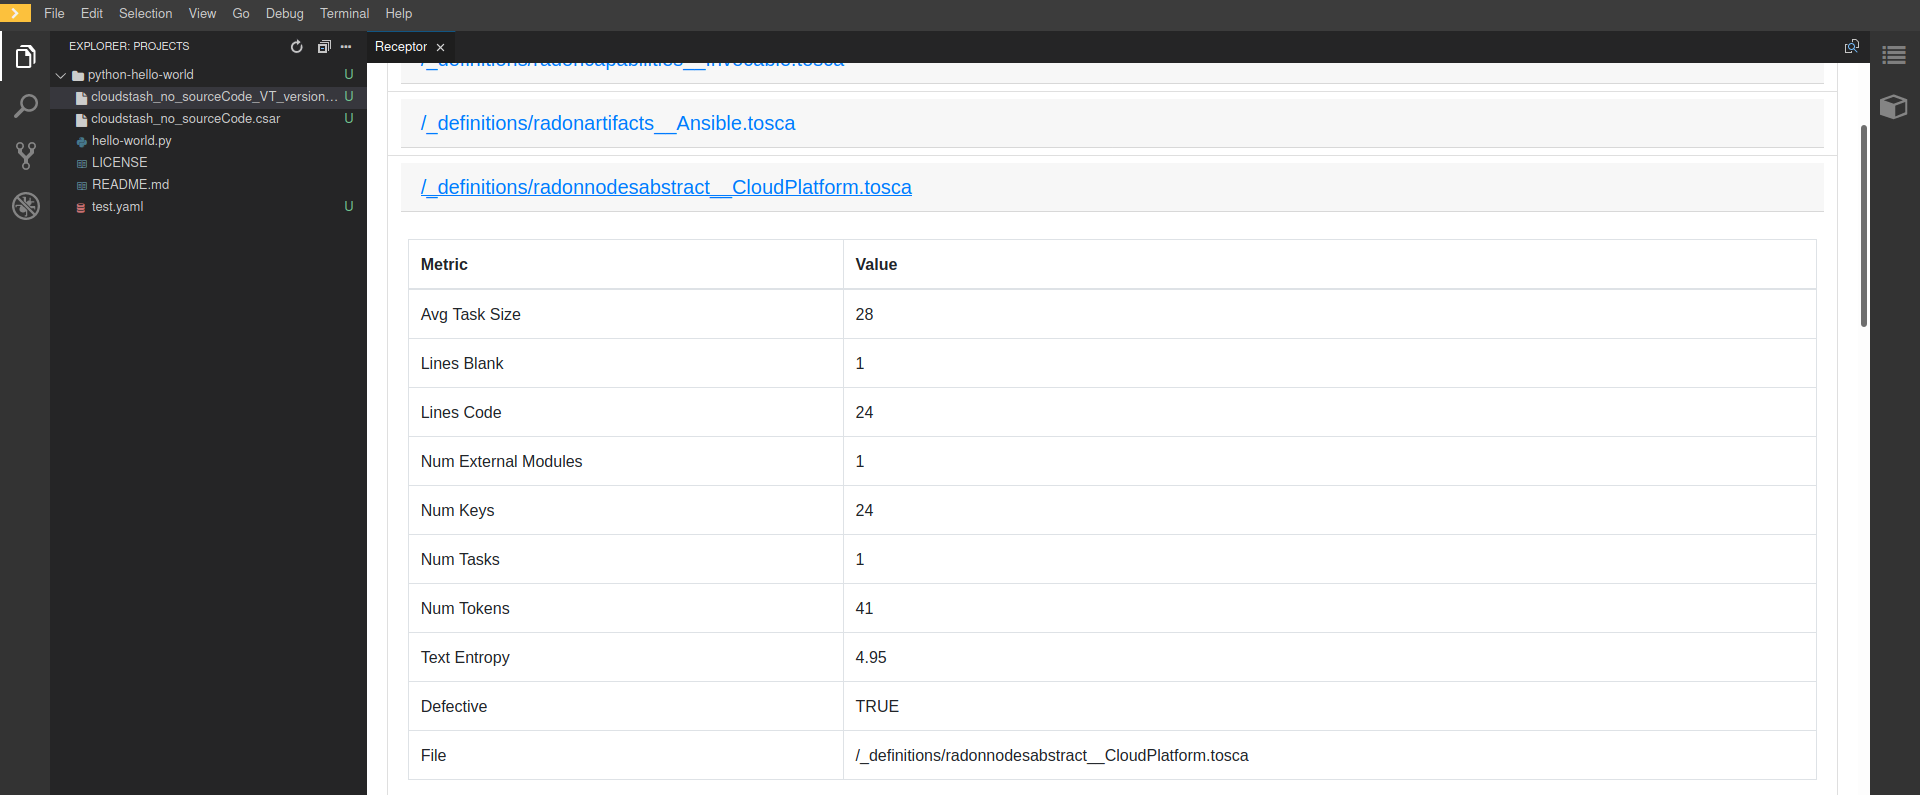
Figure 19: Defect Prediction Tool output window for CSAR files.
Continuous Testing Tool
The Continuous Testing Tool (CTT) provides the means to deploy the application that is supposed to be tested, the so-called system under test (SUT), and a testing agent, the so-called test infrastructure (TI), that executes the defined tests against the SUT. After the deployment has succeeded, the defined test is executed and the results are obtained. The complete functionality of the tool is described in the CTT documentation.
In this documentation, we go through the test of the “ServerlessToDoListAPI” and an endpoint test that makes sure that the deployment was successful. The SUT is FaaS-based implementation of a ToDo-list using AWS services, especially AWS lambda functions. The TI consists of a Docker container of a test agent for CTT that is deployed on top of an AWS EC2 instance.
To make this example work, some information is needed beforehand: AWS Access Key ID, AWS Secret Access Key, AWS EC2 SSH Key Type (e.g., OPENSSH, RSA), AWS EC2 SSH Key, AWS EC2 SSH Key Name, AWS VPC Subnet ID.
The concrete steps are as follows:
1. Preparing the Workspace with Credentials In order to use CTT in the context of the RADON IDE, some credentials need to be provided when the workspace is created. In the future, this step will be made more comfortable to conduct. The said credentials are required in order to deploy the SUT and the TI on the respective service providers’ infrastructures (e.g., AWS).
These credentials need to be filled in into the workspace configuration devfile.yaml before the workspace is created.
The following code listing shows an exemplary excerpt of the devfile.yaml’s CTT env-section on how the fields need to be populated with the credentials.
env:
 - name: OPERA_SSH_USER
   value: "ubuntu"
 - name: OPERA_SSH_IDENTITY_FILE
   value: "/tmp/aws-ec2"
 - name: AWS_ACCESS_KEY_ID
   value: "AKSDF4353SFD3NMGXHERWQ"
 - name: AWS_SECRET_ACCESS_KEY
   value: "6QYMAS4sdfhAHDJ1L+pfgqZt/9OcxUN8a1/vg/ly"
 - name: KEY_TYPE
   value: "OPENSSH"
 - name: SSH_PRIV_KEY
   value: >
     c3BlbnNzaC1rZXktdjEAAAAABG5vbmUAAAA
     NhAAAAAwEAAQAAAxUA9DcKpAwyCTystithD
     [..]
     Akawm0cQ55NZ76el6jzUWBDePeT7mmWUCfm
     kVpfAebH2+m6/F/KpFE2Q8aFBhWSVD3SmX5
     YPAAAAAAECCwQ=
Once these variables are set, the workspace can be created.
2. Configuring the Test Scenario
Once the workspace is started and completely loaded, we create a new directory that holds all files that are needed to execute CTT.
In this example, we name it ServerlessToDoList.
The CSAR files of the Serverless ToDo-List API service template and the CTT Deployment Test Agent are put into this directory, as well as an inputs.yaml file that provides some inputs needed for the deployment of the TI.
It is necessary to fill in the fields vpc_subnet_id with the VPC subnet ID on AWS the instance is supposed to be deployed to, and ssh_key_name represents the SSH key name that is stored in AWS for deploying EC2 instances.
The field ssh_key_file should stay as is.
The following code listing shows an exemplary inputs.yaml file.
---
vpc_subnet_id: "subnet-04706a8b41abdefa5"
ssh_key_name: "awsec2"
ssh_key_file: "/tmp/aws-ec2"
...
The configuration of the CTT execution itself is specified by a YAML configuration file. In this file, the following properties need to be defined:
- Name for the test configuration [
name] - Folder, the artifacts are placed in [
repository_url] - SUT CSAR path (relative to the folder) [
sut_tosca_path] - SUT inputs file (optional, relative to the folder) [
sut_inputs_path] - TI CSAR path (relative to the folder) [
ti_tosca_path] - TI inputs file (optional, relative to the folder) [
ti_inputs_path] - Test Id of the test to be executed (not yet taken into account) [
test_id] - Results output file path (relative to configuration file) [
result_destination_path]
The following code listing shows an exemplary CTT configuration file named ctt_config.yaml.
{
  "name": "ServerlessToDoList-DeploymentTest",
  "repository_url": "ServerlessToDoList",
  "sut_tosca_path": "todolist.csar",
  "ti_tosca_path": "deploymentTestAgent.csar",
  "ti_inputs_path": "inputs.yaml",
  "test_id": "test_1",
  "result_destination_path": "serverless-test-results.zip"
}
Please note that the folder property is currently named repository_url for technical reasons. In the future, this property will be renamed.
The resulting scenario can be seen in Figure 20.
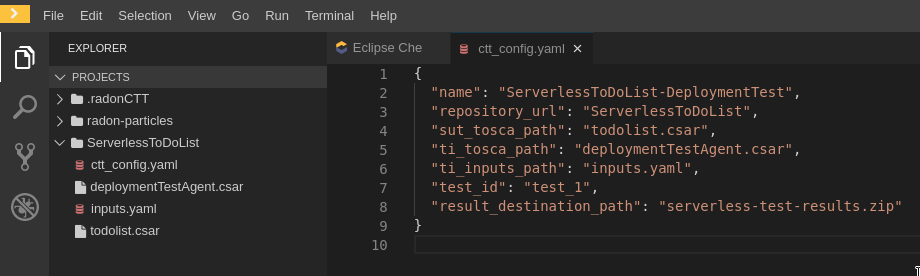
Figure 20: Severless ToDo-List API scenario in the RADON IDE
3. Executing CTT
After all preparations are finished, you can right-click on the ctt_config.yaml file and choose the option RadonCTT: Execute test configuration.
The progress can be seen in the output panel (see Figure 21) and a progress bar appears on the lower right.
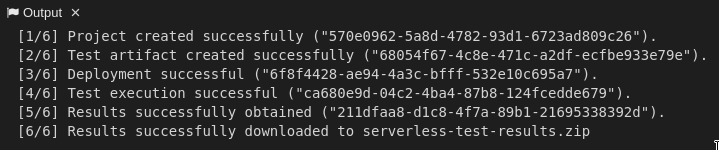
Figure 21: Progress log in the output panel of the RADON IDE
Depending on the underlying infrastructure, this process can take some time until the process is finished.
Once the process is finished, you can find the results in a ZIP-file located in the place you specified in the configuration file in result_destination_path (in this example, this would be serverless-test-results.zip).
Template library
The Template library RADON IDE plugin is used for communication between Template library and the RADON IDE (Eclipse Che). Using the plugin, the user is able to manage, store and retrieve his TOSCA modules (templates, blueprints (CSARs)) and their implementations (e.g. Ansible playbooks) from Eclipse Che Theia or Visual Studio Code.
To prevent any possible confusions remember that Template library (service) or its parts may also be called TPS (Template Publishing Service) or TLPS (Template Library Publishing Service). If you are totally unfamiliar with TPS you can take a look at the [Template library’s documentation](https://template-library-radon.xlab.si/docs/).
Main features
The extension uses the [Template library REST API](https://template-library-radon.xlab.si/swagger/) and can therefore invoke various Template library actions.
Currently, supported actions are:
- setting Template library REST API endpoint
- creating and publishing TOSCA template or CSAR and its version
- downloading a specific template version files
- deleting saved login info (KeyCloak cookies)
Usage
The plugin is invoked by right clicking on the file from file explorer or in the editor. There are four commands that can be selected from the dropdown options and these are further explained within the next sections.
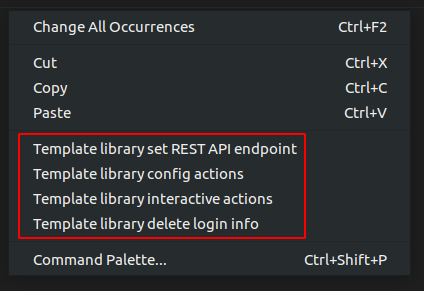
Figure 22: Template library plugin commands
Template library authentication
When right clicking on any Template library plugin command (except from set API endpoint and clean login info commands), the extension will verify user’s credentials if the data has been saved. So, the first time when user wants to use the plugin, he will be offered a set of options to select the prefferd authentication method for the Template library. Since Template library auth works through KeyCloak, there can be multiple login methods. You can login with:
- XLAB KeyCloak native credentials (available at https://openid-radon.xlab.si/auth/realms/master/account)
- RADON and other identity providers that are connected to the XLAB KeyCloak
- Native Template library credentials (a new user can be created by following these instructions: https://template-library-radon.xlab.si/)
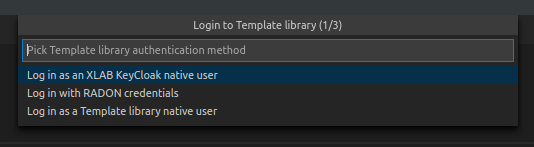
Figure 23: Template library plugin auth
If the login does not succeed, you will be warned and will have to login again. If the login succeeds, the KeyCloak auth cookies will be stored into the local storage and next time you invoke the any plugin command, you won’t have to login again. But if you for instance set Template library API endpoint to something else or if you wish to login as another KeyCLoak user, the it is wise to clear saved login data by invoking the “Delete login info” action. If you log in as a native user, no data will be saved and you will have to login again every time you use the plugin.
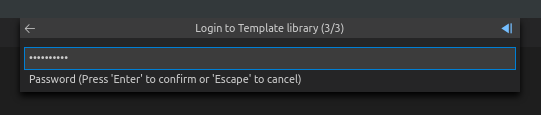
Figure 24: Password prompt
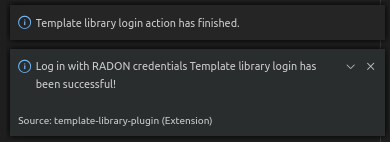
Figure 25: Login success
Template library set REST API endpoint
This command is used to set TPS REST API endpoint that will be used for executing the TPS HTTP requests. The default value here is https://template-library-radon.xlab.si/api which is pointing to the public TPS REST API URL. This command was meant mostly for testing different versions of TPS API so currently there is no need to change it.
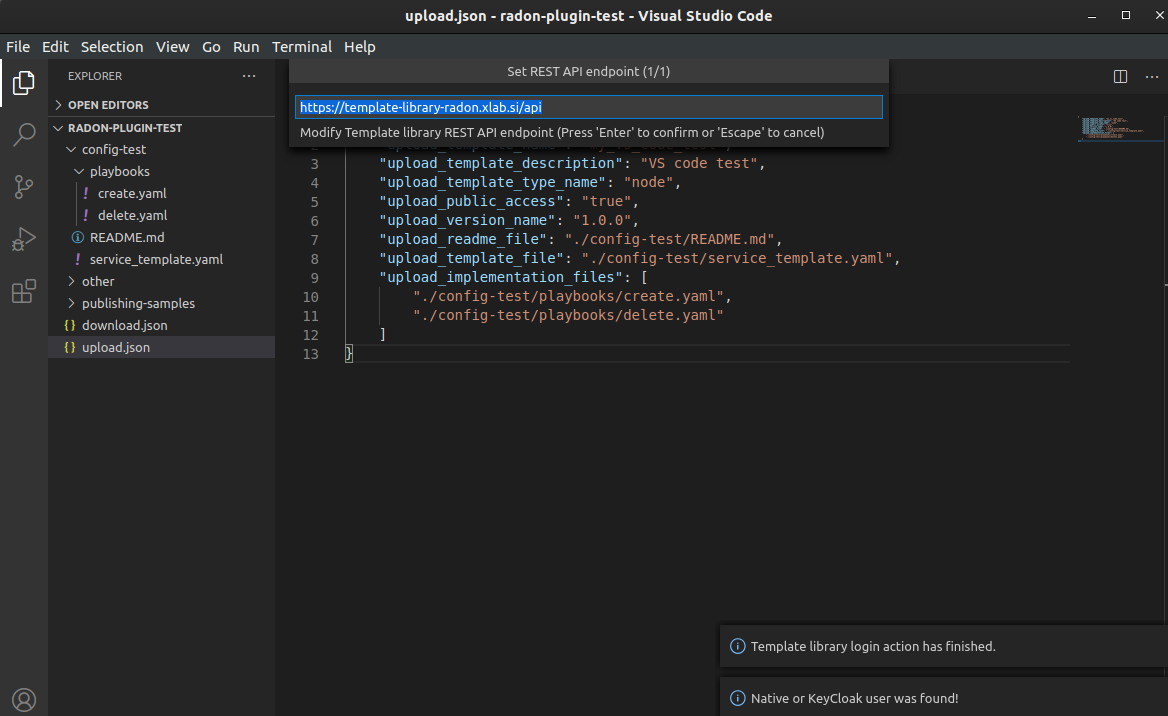
Figure 26: Set TPS REST API endpoint
Template library config actions
If you choose this option the TPS actions can be invoked via JSON config file. If you right clicked on the JSON file (from the editor or from the file explorer) you will be offered to chose it as a config file. If not, you will be asked to select this configuration file from other folders.
JSON object that is present in the config file should follow an exact structure with which depends on the type of the action. The JSON keys specified are not mutually exclusive so you can execute multiple TPS actions with one JSON config file.
Create template JSON config
JSON object for creating a template must have all these keys:
| JSON key | Description |
|---|---|
| upload_template_name | Template name you want to create |
| upload_template_description | Template description |
| upload_template_type_name | Template type name (e.g. node, relationship, csar,…) |
| upload_public_access | Make template publicly visible for other TPS users (true/false) |
Example:
{
    "upload_template_name": "aws_bucket",
    "upload_template_description": "AWS bucket node",
    "upload_template_type_name": "node",
    "upload_public_access": "true"
}
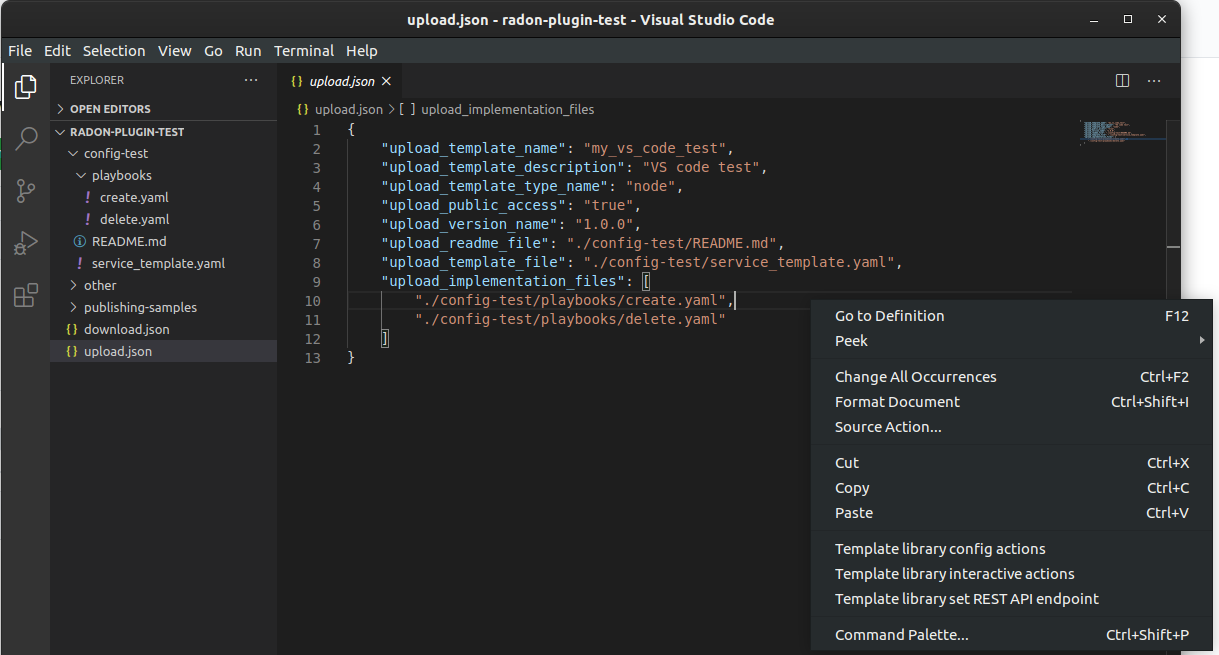
Figure 27: Upload config action
Upload template version JSON config
When uploading a template version you can use the following keys (upload_readme_file and upload_implementation_files are optional).
| JSON key | Description |
|---|---|
| upload_version_name | Semantic version name |
| upload_readme_file | Optional path to README file to upload |
| upload_template_file | TOSCA YAML service template file or compressed TOSCA Cloud Service Archive (CSAR) |
| upload_implementation_files | Optional JSON array of paths to TOSCA model implementation files (Ansible playbooks) |
Example:
{
    "upload_version_name": "2.1.5",
    "upload_readme_file": "./aws_bucket/README.md",
    "upload_template_file": "./aws_bucket/service_template.yaml",
    "upload_implementation_files": [
        "./aws_bucket/playbooks/create.yaml",
        "./aws_bucket/playbooks/delete.yaml"
    ]
}
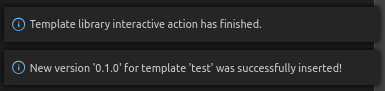
Figure 28: Successful template version upload
Download template version JSON config
When downloading template version files you will get all version files (TOSCA template and playbooks) compressed in a zip file (if you provided just a CSAR without implementation files, you will get back this CSAR).
| JSON key | Description |
|---|---|
| download_template_name | Name of the template you want to download |
| download_version_name | Semantic template version you want to get files from |
| download_path | Path where downloaded file will be stored |
Example:
{
    "download_template_name": "aws_bucket",
    "download_version_name": "2.1.5",
    "download_path": "./AwsBucket.zip"
}
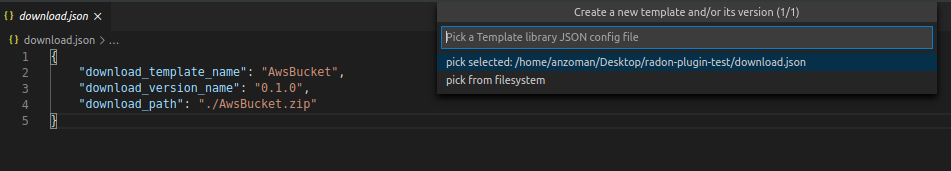
Figure 29: Download config action
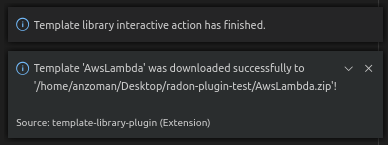
Figure 30: Successful template version download
Template library interactive actions
This TPS RADON IDE extension command will guide you through an interactive Eclipse Theia tasks, where you will be able to create templates, upload template versions or download version files from Template library service. More images from the plugin are can be found here: https://github.com/radon-h2020/radon-template-library-publishing-service-plugin.
Template library delete login info
This Template library plugin command will make sure that the saved login data gets deleted (e.g. KeyCloak cookies). After that you will have to login again if you activate any TPS commands.
xOpera SaaS
The xOpera SaaS orchestrator is used to deploy the application blueprint (CSAR) within the RADON IDE. Initially, the TOSCA opera orchestrator was available only as a CLI tool (it can be be downloaded from the Python Package Index: https://pypi.org/project/opera/)
The SaaS orchestrator has been developed with the integration in mind and includes the API allowing managing all orchestrator functions and the integration with KeyCloak identity manager that allows easy integration with other identity management services.
Apart from Identity Manager (KeyCloak) and a web GUI, the orchestrator has also Che and Visual Studio Code plugin that provides the ability to create and run deployment projects created inside the SaaS orchestrator.
There are currently two commands that can be invoked from the explorer Eclipse Che Theia/Visual Studio Code context. These are:
- “xOpera SaaS: Create project from CSAR”
- “xOpera SaaS: Delete login info”
The authentication to the SaaS component is performed in the similar way as this is done for the Template library. This means that when using the SaaS plugin the first time, the user will be prompted to select his preferred way of logging in. This can be either through an XLAB KeyCloak instance or through any of the connected identity providers (like RADON IDE KeyCloak). After that the login data will be saved and the user will be able to invoke the plugin commands (if the user would want to remove his saved login data he could click on the “xOpera SaaS: Delete login info” option).
The main command is “xOpera SaaS: Create project from CSAR”. By invoking this, the plugin currently allows users to:
- create a new workspace
- create a new project in a new or existing workspace
- deploy a project
The functions through the plugin are a bit limited, as it is more convenient than other actions are performed through the Opera SaaS web interface.
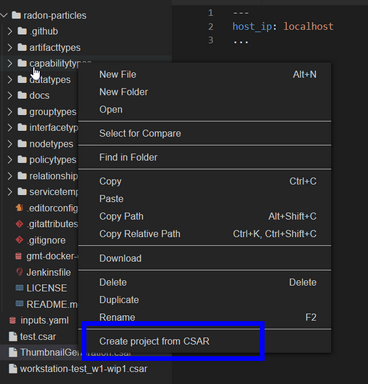
Figure 31: Deployment of the CSAR.
User can invoke the main plugin actions by right clicking on the compressed TOSCA CSAR (file should include .zip or .csar extension). Then the plugin will interactively guide him through the creation of workspace and the project.
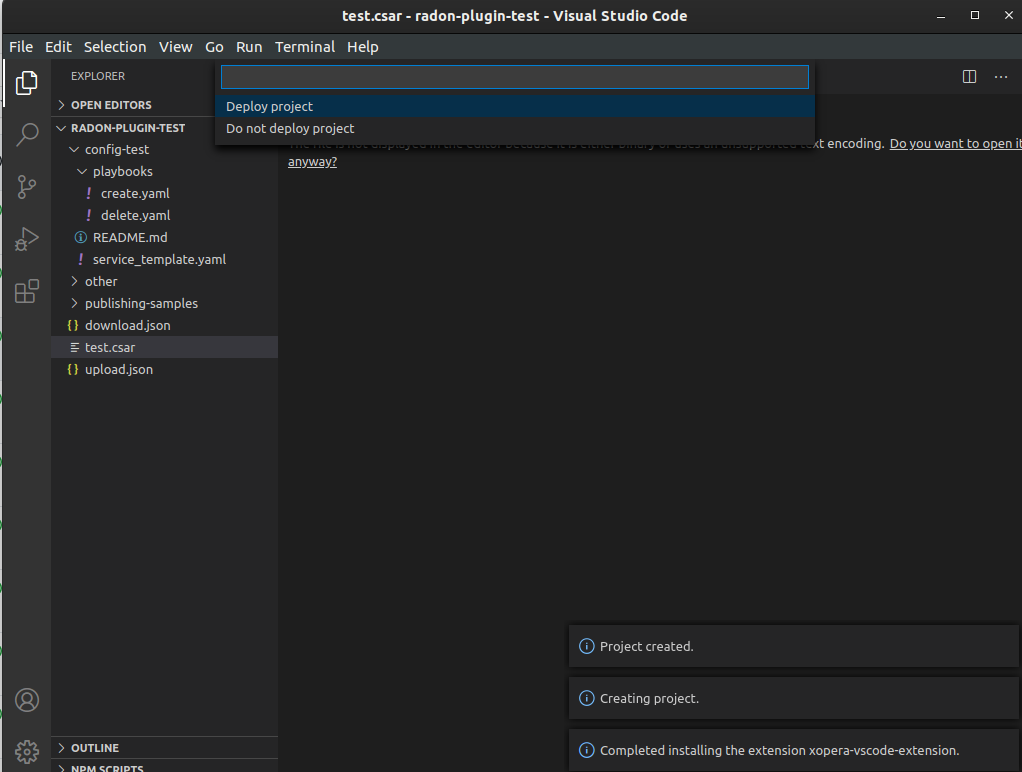
Figure 32: Creating a new project.
After that you will be asked if you want to deploy the CSAR from the project. The deployment process starts right away and gives you the deployment outputs from the xOpera SaaS orchestrator. Then the plugin will then redirect you to the SaaS UI where you will be able to see your created workspace and project.
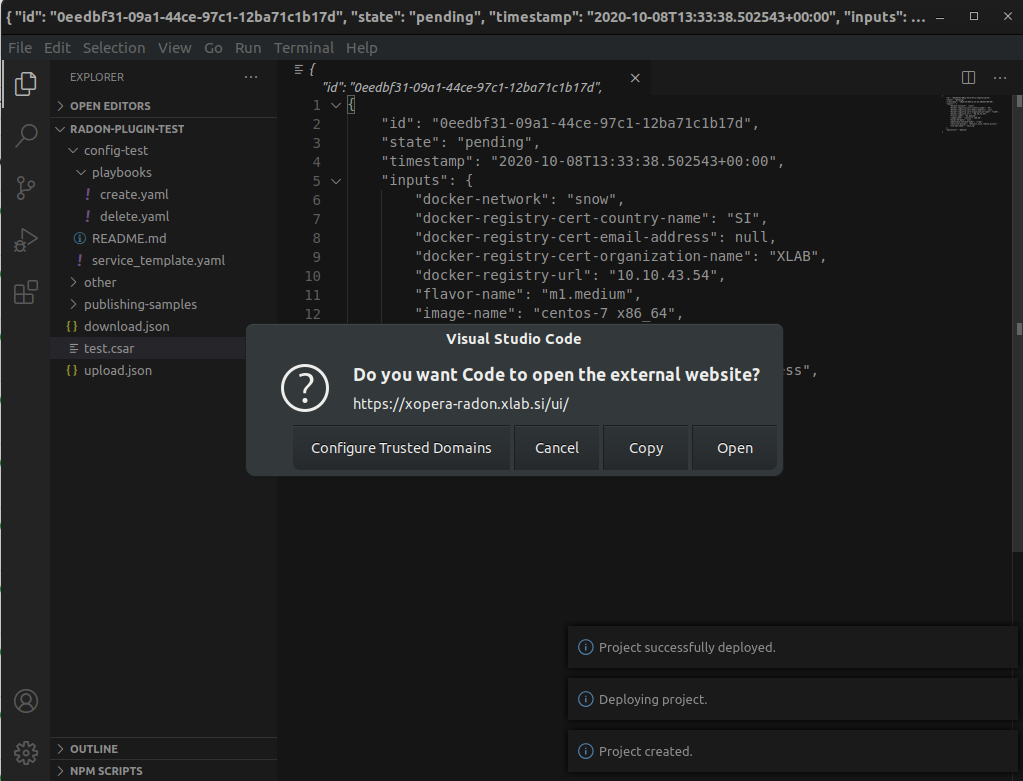
Figure 33: The xOpera SaaS plugin redirection.
CI/CD Plugin
The user can configure and trigger CI/CD pipelines through the IDE. The use of CI/CD pipelines provides more flexability, for instance it is possible to include different tollgates in the deployment process (i.e. the job pipelines can be complex as you want).
CI/CD preconditions
- A configured Jenkins server
- A user with execution access to jobs
- A configured CI/CD pipeline
Setup guides can be found in CI/CD templates and are available for two different CI/CD technologies: Jenkins and CircleCI.
The tools covered by the templates repository are:
- CTT - Continuous Testing Tool
- VT - Verification Tool
- DPT - Defect Prediction Tool
- TL - Template Library
- xOpera - Orchestrator
The above tools have its corresponding folder where examples are listed. You as a user are free to cherrypick the code snippets in order to generate the ideal CI/CD pipeline. Figure 34 beneath depicts a configuration where a CSAR is fetched from Template Library and deployed to AWS cloud.
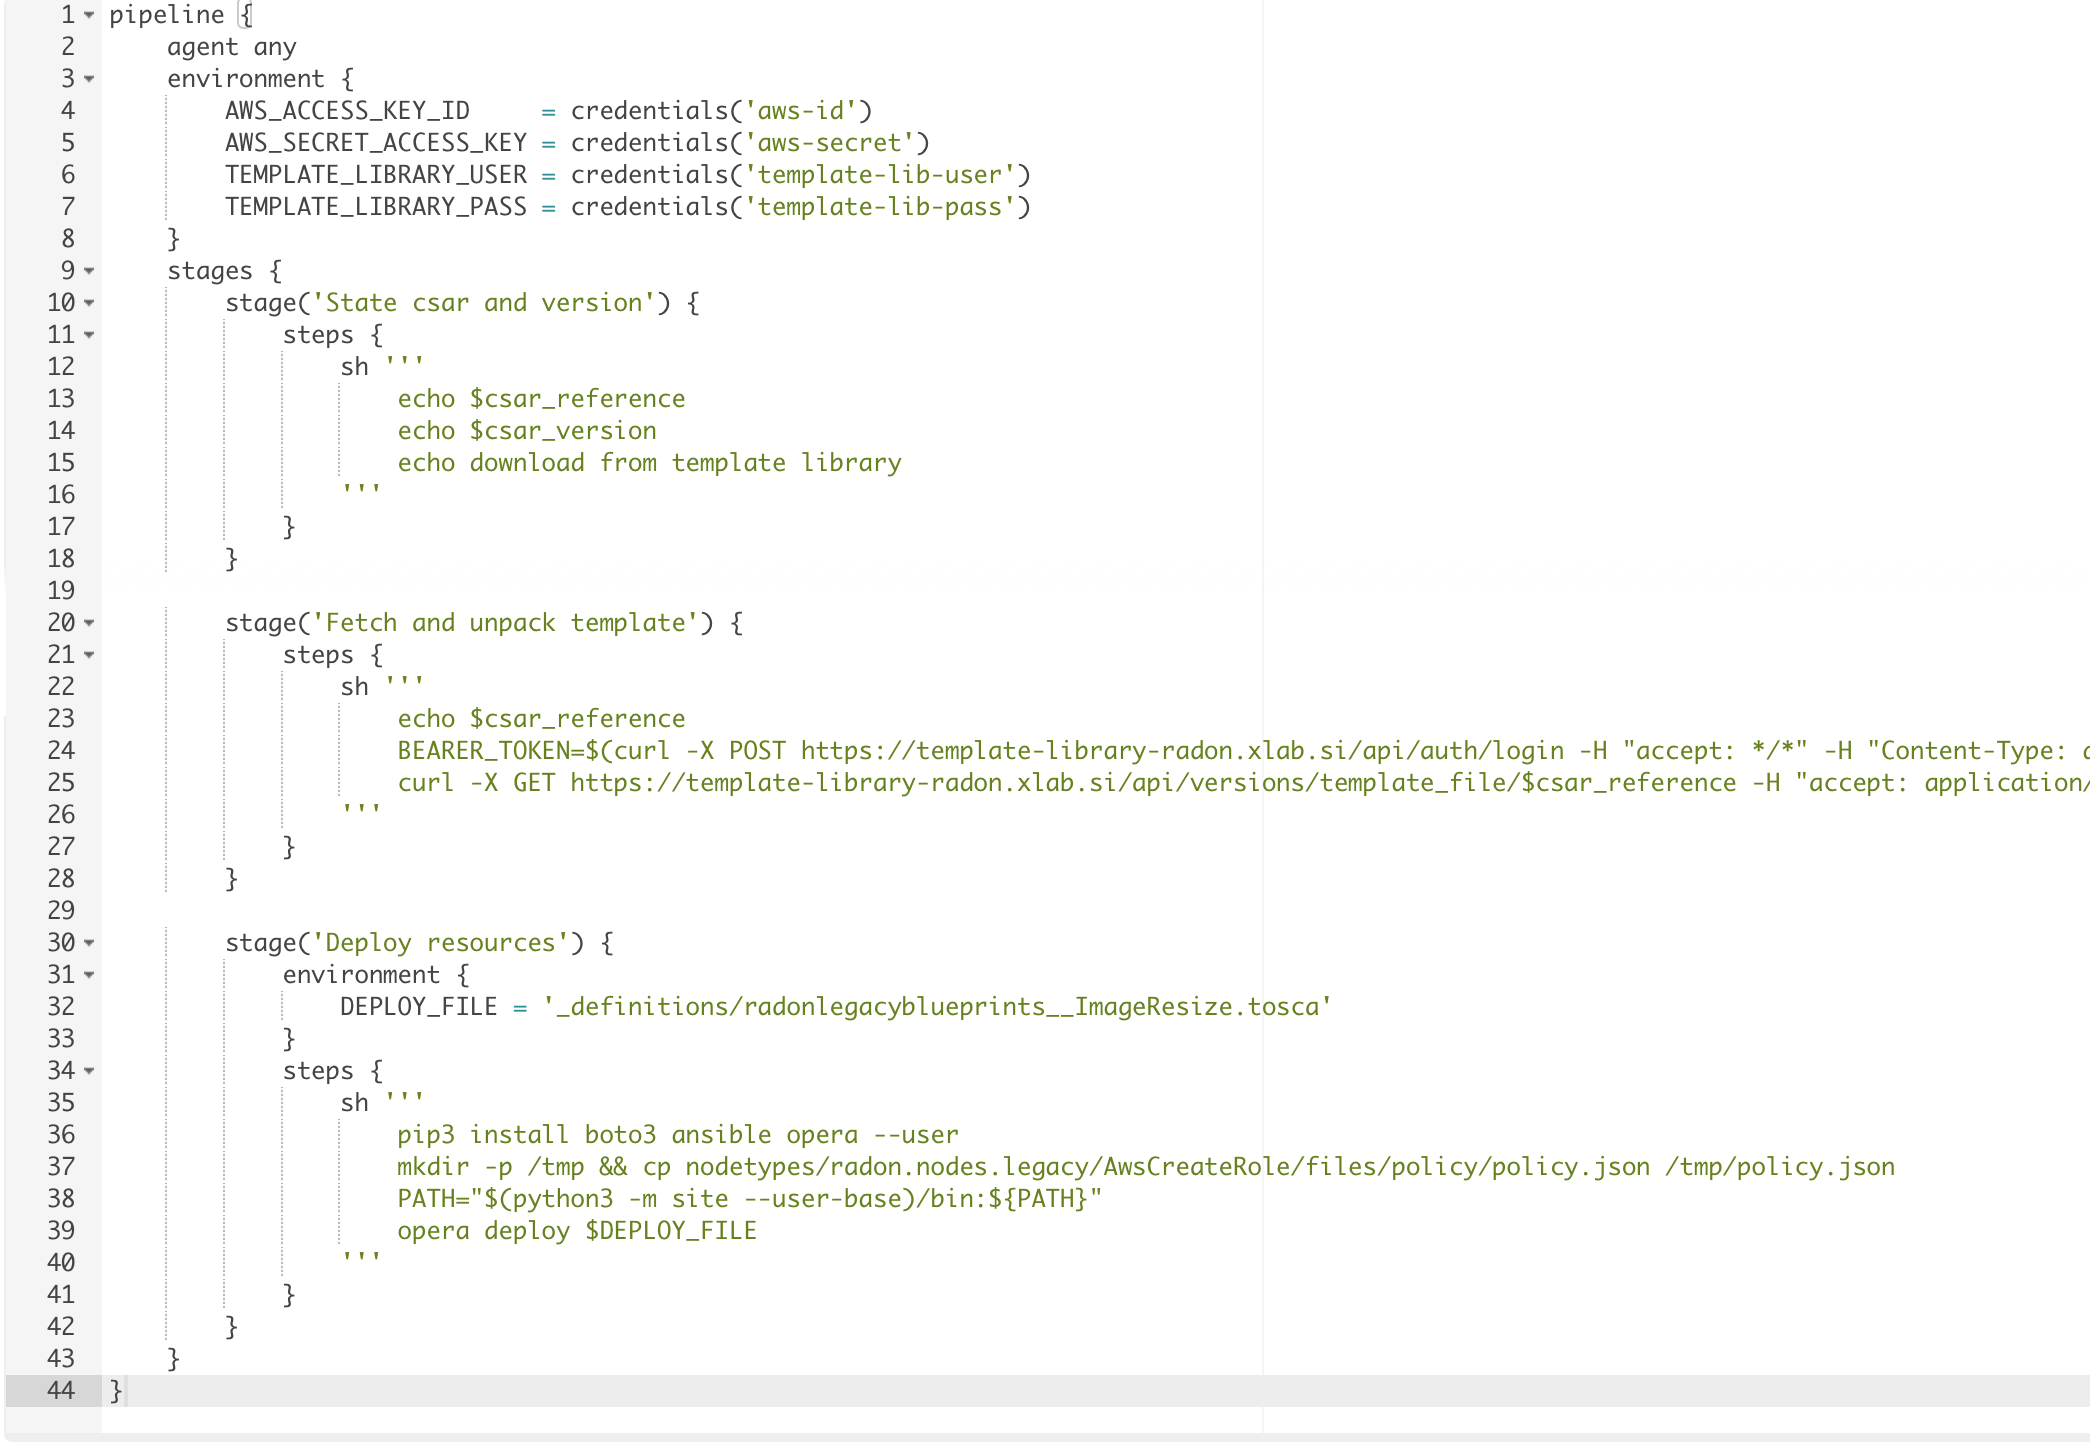
Figure 34: Example of CI/CD pipeline
CI/CD execution
As depicted in Figure 35 the user can select a CSAR from the file explorer and, with a right-click, select the Configure CI command.
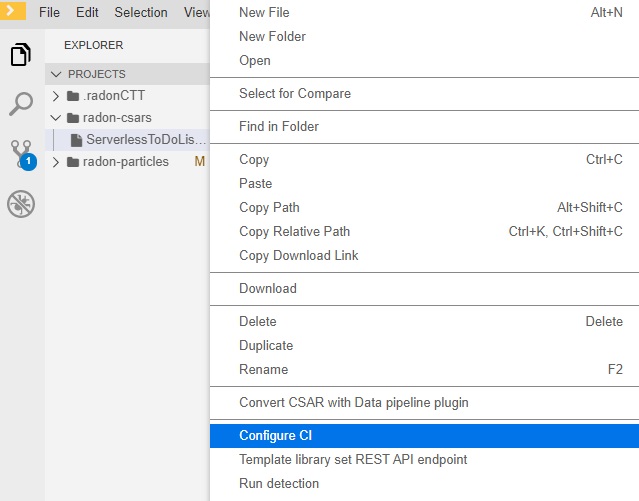
Figure 35: Configure CI.
The system will generate a new configuration file (i.e. a yaml file) containing the following parameters to set:
- CSAR_name: The name of the CSAR as uploaded in the Template Library;
- CSAR_version: The version of the CSAR as as uploaded in the Template Library;
- Jenkins_URL: The URL of the Jenkins server;
- Jenkins_username: The username of Jenkins credentials;
- Jenkins_password: The password of Jenkins credentials;
- Jenkins_job: The job (i.e. CI/CD pipeline) that must be triggered;
- Jenkins_job_token: The Authentication Token associated to the job;
- cookie_jar: Parameter used to get a Jenkins crumb. Use the value /tmp/cookies
Please note that the selected CSAR must be already uploaded on the Template Library using the CSAR_name and CSAR_version specified in the yaml configuration file.
Example:
{
   "CSAR_name": "DemoBlueprintAws",
   "CSAR_version": "0.1.0",
   "Jenkins_URL": "http://91.109.58.116:8080/",
   "Jenkins_username": "radonTest",
   "Jenkins_password": "radonTest",
   "Jenkins_job": "job/ENG/job/IDE-plugin/job/Template-Library-Deploy",
   "Jenkins_job_token": "toy-app",
   "cookie_jar": "/tmp/cookies"
}
Once the configuration yaml file has been edited the user can select it and, with a right-click, select the Trigger CI command (Figure 36).
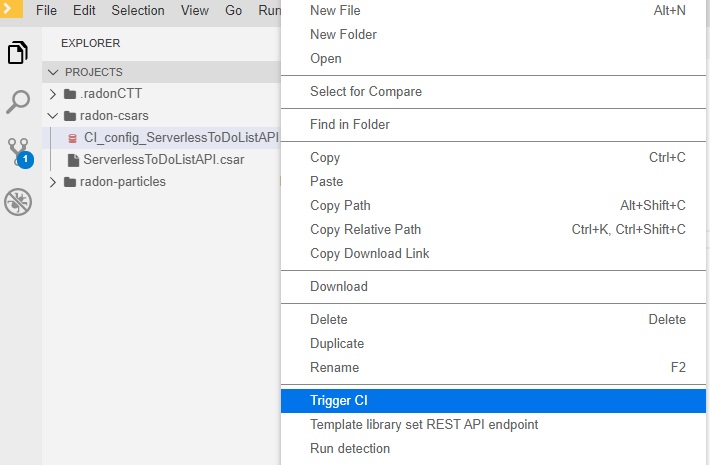
Figure 36: Trigger CI
Finally, the CI/CD pipeline specified in the yaml configuration file will be triggered and execute in the Jenkins server.
Data Pipeline Plugin
The data pipeline plugin can be used to ensure the consistency in the data pipeline-based TOSCA service template. The plugin takes the CSAR as the input and returns the modified CSAR which can be used further with other RADON tools, such as orchestrator, VT, etc. The plugin checks mainly two types of potential user-made errors. Firstly, the errors related to the connection between two data pipeline nodes. Here, the plugin checks if two pipeline nodes are connected with the correct relationship type. This also checks if multiple connections exist between any pair of pipeline nodes. Secondly, the plugin also updates the CSAR with correct configuration if it found any improper encryption configuration. The detaild informaiton on data pipeline can be found here.
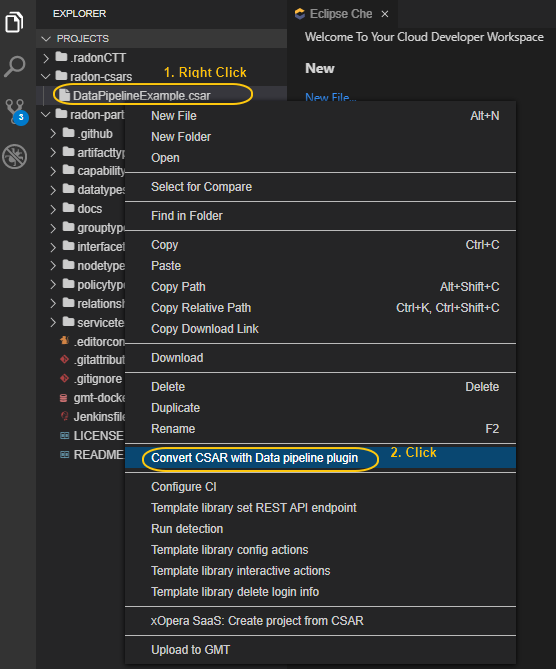
Figure 37: Option to invoke data pipeline plugin
To invoke the data pipeline plugin with exported CSAR (in this case DataPipelineExample.csar), right click on the csar and select Convert CSAR with Data pipeline plugin option, as shown in Figure 37. The converted csar will be exported to the same folder structure, in this case the output is DataPipelineExample_converted.csar, as shown in Figure 38.
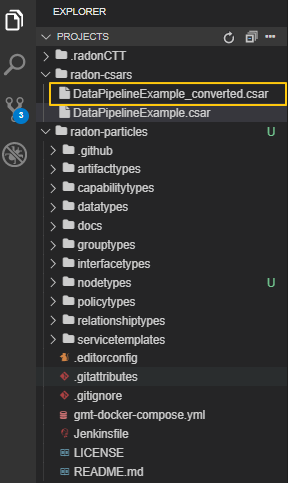
Figure 38. Data pipeline plugin output
Other RADON Commands
From the command palette of the IDE (shown with Ctrl+Shift+P), a RADON menu (Figure 39) is available to perform the following actions:
- Open the RADON Help Page by selecting the Open Help Page option. Once this command is selected a browser window connecting to the RADON methodology GitHub page will be opened;
- Open the RADON Monitoring Page by selecting the Open Monitoring Page option. Once this command is selected a browser window connecting to the RADON Monitoring Dashboard will be opened;
- Open the RADON Show Deployment Page by selecting the Show Deployment status option. Once this command is selected a browser window connecting to the xOpera SaaS Dashboard will be opened.
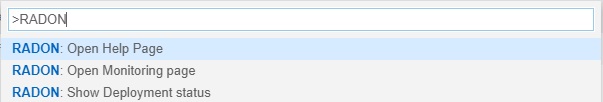
Figure 39: RADON menu in the command palette.
Additional Information
Links
- Code repository: https://github.com/radon-h2020/
References
- Graphical Modeling Tool: https://winery.readthedocs.io/en/latest/user/getting-started.html
- Verification Tool: https://radon-vt-documentation.readthedocs.io/
- Decomposition Tool: https://decomposition-tool.readthedocs.io/
- Defect Prediction Tool: https://radon-h2020.github.io/radon-defect-prediction-cli/
- Continuous Testing Tool: https://continuous-testing-tool.readthedocs.io/
- Orchestrator: https://xlab-si.github.io/xopera-docs/
- Template Library: https://template-library-radon.xlab.si
- Delivery Toolchain: https://radon-h2020.github.io/radon-delivery-toolchain/
- Data Pipeline Plugin: https://datapipeline-plugin.readthedocs.io/
Contact
- Stefania D’Agostini, Engineering Ingegneria Informatica S.p.A, Italy
Acknowledgments
This work is being supported by the European Union’s Horizon 2020 research and innovation programme (grant no. 825040, RADON).